V-Dem is a Swedish-based organization with global reach. It draws on a team of 3,700 experts in global and national politics to prepare annual reports, since 2017, on the details of democracy (or autocracy—its opposite) and the political rights within every nation of the world. V-Dem is based in the Department of Political Science at the University of Gothenburg.
Each annual report, released in March to summarize levels of democracy in the previous calendar year, is published online. The site is easily searchable and can provide information on any nation, with annual data all the way back to 1972. The 2023 report, focusing on the past 10 years, argues that levels of democracy fell suddenly back to those last seen in 1986.
Snapshot: Levels of Liberal Democracy, 2022
V-Dem’s Liberal Democracy Index (LDI) combines multiple aspects of two measures. Electoral democracy is the degree of multiparty elections, free discussion, and media; the liberal component includes checks on the executive, respect for civil liberties, and independence of legislature and judiciary. As shown in Map 1, these estimates are combined to give scores from 0 (in red) to 1 (in blue).
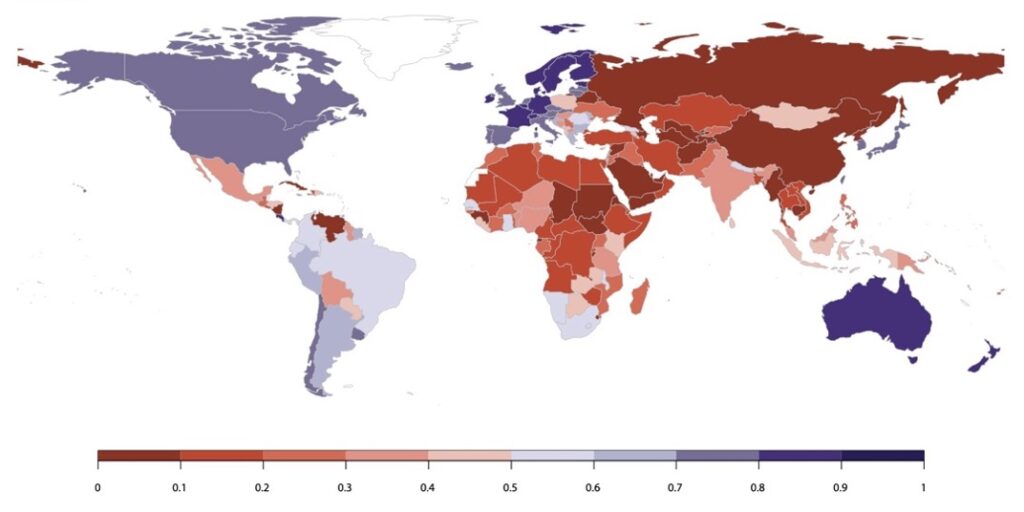
The overall picture in Map 1 looks like a bipolar world: a democratic Western Europe and North America, and autocracies in most of the rest of world. Can one generalize and say that this split reflects good government in a few countries and unfair government elsewhere? No. But the issue here is how involved each nation’s citizens are in the choices and activities of their governments. The V-Dem report explores these complexities further.
Democracy’s 50 Years of Change, 1972–2022
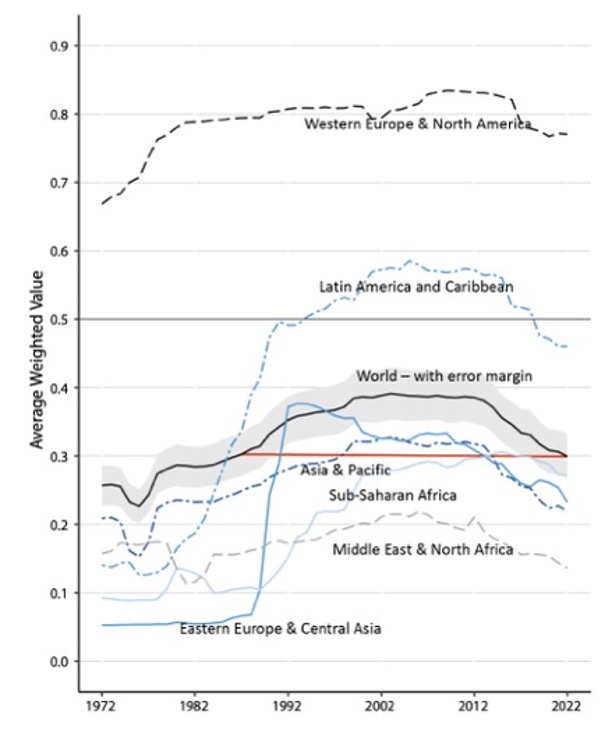
The V-Dem report categorizes countries by region—Africa, North and South America, Middle East, Europe, and Asia-Pacific—and over time. It ranks individual countries by their level of democracy, showing confidence intervals for each observation. V-Dem relies on at least five experts for each country in each year. Figure 1 summarizes V-Dem results by region and over time, presenting the regions of the world and their levels of democracy over the past 50 years, from 1972 to 2022.
Here again, Western Europe and North America show the highest levels of democracy. But the clearest pattern is the fluctuations in levels of democracy everywhere, with an overall global rise in levels of democracy from the 1970s to about 2012, followed by a rapid decline in democracy for every area of the world. How and why has every region experienced declining democracy and rising autocracy since 2012? And what does it mean to say that the level of global democracy today has fallen back to the level of 1986, as V-Dem shows in Figure 1? For one thing, it appears clear that the ups and downs in democracy in one country affect those in other countries.
Ways to Explore V-Dem
A great strength of the V-Dem annual report (and its other documents) is its detailed explanation of methods and evidence, so that you can check out its reasoning and develop your own ideas on democracy. In addition to the overall LDI measure, V-Dem divides nations into four groups, labeled as liberal democracy (LD), electoral democracy (ED), electoral autocracy (EA), and closed autocracy (CA). Lists of nations and their levels of democracy (1972–2020) are provided, as well as categories of country scores for liberal democracy. The methods of calculating indices are also shown.
V-Dem’s analysis focuses on the interplay of governments and citizens, but does not give direct attention to other great forces of life today, including large-scale institutions, private corporations, and ordinary citizens—both male and female. However, as you explore the details of the report, you can see where large institutions are included and left out, and you can see whether the category of “citizens” gives adequate attention to females.
The Global Rise in Autocracy, Since 2012
V-Dem estimates that, for 2022, 28 percent of countries were closed autocracies while 13 percent of countries were liberal democracies. How can one explain the recent rise in autocracy? V-Dem does not offer a simple response. Instead, it presents large amounts of information, country by country. This section presents a few examples of that evidence.
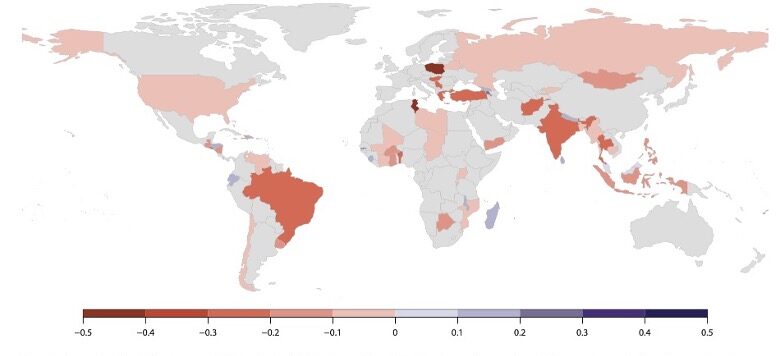
Map 2 compares 2012 and 2022, showing the countries where autocracy increased the most (in red) and where democracy increased the most (in blue). The faint blue for Madagascar, Ecuador, and others shows that democracy, when it advanced, grew only a little. Autocracy grew in more countries and by larger amounts. Overall, 14 countries are democratizing, while 42 countries are autocratizing. Why were the countries with expanding democracy mostly small and isolated? It may mean that the strongest forces for democracy are within nations and that some countries can escape the global pressures for autocracy—whatever those pressures are.
In addition to these overall summaries, the report collects data on media censorship, false information from governments, freedom of discussion among citizens, free and fair elections, freedom of movement, and many others. It gives detailed reports on Iran, Greece, Brazil, and Russia. One section of the report lists the countries that have shown the biggest changes toward autocracy.
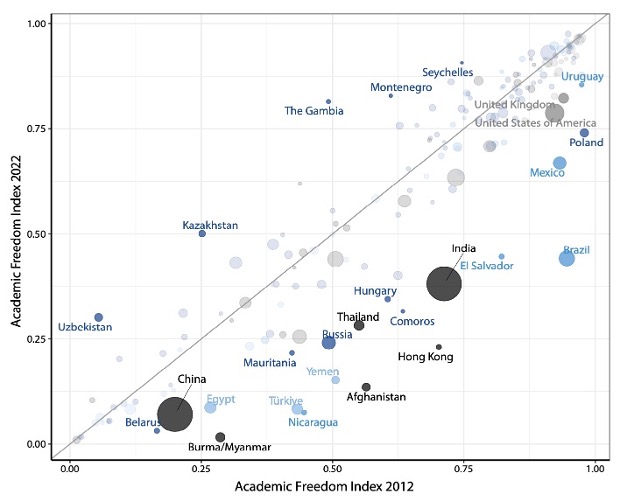
The report also explores academic freedom, comparing 2012 to 2022. Figure 2 shows that countries above the diagonal have more academic freedom in 2022, while countries below the diagonal have less academic freedom in 2022. The U.S. and UK show a high level of academic freedom, but it declined significantly by 2022. India is shown with higher academic freedom than China, but Indian academic freedom declined more rapidly, while China’s academic freedom declined at a rate similar to that of the U.S.
This blog post explores just a few of the highlights within V-Dem’s 2023 Democracy Report, which draws from, as V-Dem puts it, “the largest global dataset on democracy with over 31 million data points.” I urge you to dive deeper into this rich resource, explore the findings, ask questions, and consider the factors that may have contributed to democracy’s backslide in recent years.
Pingback: Why Is Democracy on the Decline? A Look at Global Trends from V-Dem – Patrick Manning