The V-Dem project, “Varieties of Democracy,” provides data on democracy and autocracy in all nations and colonies of the world. When V-Dem (founded 2014) did its calculations for the 1970s, democracy was on the rise, continuing a trend seen throughout the 20th century as countries around the world shifted away from the imperial autocracies of previous times. Since 2012, however, V-Dem’s report shows a democratic backslide: Today, the average global level of national democracy has returned to levels similar to those of 1985.
I wrote an introduction to V-Dem a year ago. In this follow-up post, I add more on V-Dem’s methods and begin an exploration of why levels of democracy are declining. Further, I provide a reminder that international organizations—not just nations—contribute to the rise and fall in democracy.
Methods of V-Dem
V-Dem’s analysis sorts the many types of political behavior and regulation into two categories: democracy (mutual consultation and majority rule) and autocracy (a small elite makes social decisions regardless of the majority). V-Dem field workers identify the scores for each nation, which range from 0.0 (no democracy) to 1.0 (highest level of democracy). The main sub-categories consist of two levels of democracy, two levels of autocracy, and two “grey zones” of uncertainty, as follows:
- Liberal democracy (scores 0.8 – 1.0): Fair multiparty elections plus judicial and legislative constraints on the executive along with the protection of civil liberties
- Electoral democracy (scores 0.6 – 0.8): Fair multiparty elections for the executive; satisfactory degrees of suffrage, freedom of expression, freedom of association
- Democratic Grey Zone of uncertainty (scores 0.5 – 0.6)
- Autocratic Grey Zone of uncertainty (scores 0.4 – 0.5)
- Electoral autocracy (scores 0.2 – 0.4): Multiparty elections for the executive exist; insufficient freedom of expression and association, and free and fair elections
- Closed autocracy (scores 0.0 – 0.2): No multiparty elections; absence of democratic freedom of expression, freedom of association, or free and fair elections
These scores are then calculated in various ways (by region or by regime of democracy), and V-Dem editors write up the results.
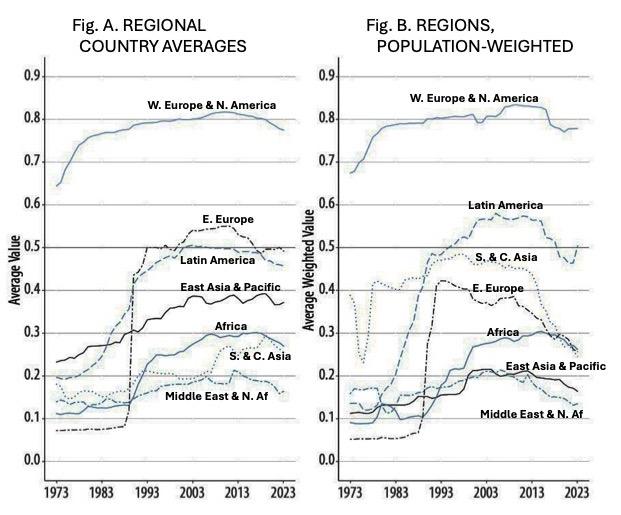
Figure A shows seven world regions and how their scores in democracy have changed over the course of a 50-year period, from 1973 to 2023. Overall, the rise in democracy from 1973 to 2010—and the decline since—is clear. Figure B offers a different way to summarize the same data: weighting each country by its population. This gives more weight to large countries but also estimates the level of democracy per person for the seven global regions. Thus, Figure B shows a rise in democracy similar to Figure A, but it shows the decline in democracy as beginning earlier (in the 1990s) for Eastern Europe and South and Central Asia.
Why is Autocracy Rising Today?
Democracy and autocracy have shifted over time, as shown in Figures C and D.
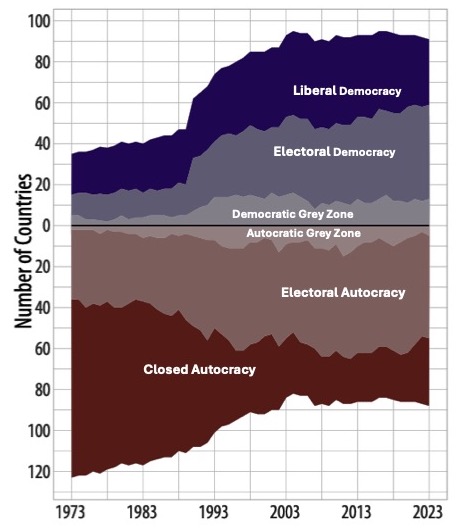
Figure C shows the worldwide changes in the six sub-categories of democracy and autocracy. (This figure also shows an increase in the number of countries V-Dem was tracking—from 145 in 1973 to 172 in 2023.) It shows an increase in countries with Liberal Democracies over time, and a bigger increase in those with Electoral Democracies. On the other hand, the number of countries with Electoral Autocracy increased to an even higher level, while countries governed in Closed Autocracy declined quite sharply. In addition, the overall “grey zone” grew larger with time, as it became more difficult to tell the difference between Electoral Democracy and Electoral Autocracy. Figure C does not show a sharp decline in democracy.
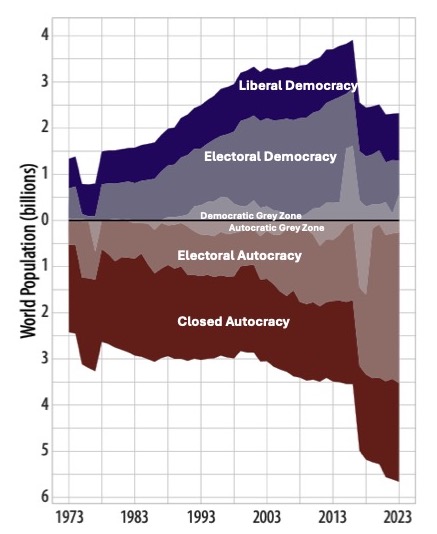
Figure D gives a different perspective, focusing on global levels of democracy per person rather than per country. (Notably, between 1973 and 2023, the world population grew from 3 to 8 billion people.) Figure D also shows that Closed Autocracy per person did not decline, reflecting the fact that many small countries became independent and relatively democratic, while big countries remained relatively stable in their level of autocracy. The most striking changes appear in the years 2015 to 2019, where the Democratic Grey Zone first expanded upward, the Autocratic Grey Zone expanded downward, and then the grey zone shrank.
What is the primary reason for this change? India was an Electoral Democracy for many years. Then, in 2015-16, it shifted to the Democratic Grey Zone (reducing significantly the total for Electoral Democracy). In 2017-18, India shifted again—this time into the Autocratic Grey Zone—and yet again in 2019 to Electoral Autocracy (expanding greatly the total for Electoral Autocracy). As a result, since 2015, the overall global pattern of democracy (population-weighted) changed dramatically.
Despite its huge population, India alone was not the cause of the global decline in democracy during this time period. Other countries shifted from democracies toward autocracies as well. The V-Dem 2024 report compares “democratizers” with “autocratizers” for nations by population. It shows, for instance, that India accounted for about half of the expansion of autocracy globally. Conversely, Brazil was responsible for about half of the (smaller) expansion in democracy.
Influence of International Organizations on Global Politics
There is more to the global political order than the national experiences of 190+ countries. Dozens of international organizations have arisen, with individual nations as their members. How do they function and influence democracy and autocracy?
After World War II, the United Nations became the core of a new global order, and other organizations emerged in its wake. Organizations of the UN itself provide seats for most or all member states, as in the UN General Assembly and the World Health Organization. Representatives of member nations met and worked in these organizations, ultimately forming a global corps of national diplomats and bureaucrats.
In assessing the influence of international organizations on the global political order, I will focus on a set of six global economic organizations that bargain for global economic benefits. Here they are in the order of their creation:
- Organization for Economic Cooperation and Development, OECD, founded in 1961 out of the European Economic Community
- G77, founded in 1964 by 77 developing nations
- G7, founded in 1975 by the big industrial powers
- World Trade Organization, WTO, founded in 1995 by the G7
- G-20, founded in 1999 as an expansion of the G7
- BRICS, founded in 2008 by developing nations within the G20, and expanding to become BRICS+ in 2023
While all these organizations still exist, the most influential are the G7 and BRICS+ and their overlap in the G20.
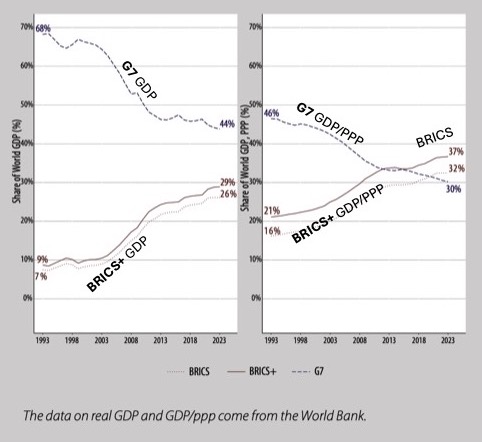
V-Dem took an interest in the tension between G7 and BRICS+, as shown in Figures E and F. Figure E summarizes the GDP (gross domestic product) for the two groups, showing how the big developing countries—BRICS nations—have now passed the G7 in value of output. The right panel in Figure F shows the output comparison in terms of PPP, or purchasing power parity. The PPP calculation, designed in 1916 by Swedish economist Gustav Cassel and implemented in practice since the 1970s, adjusts for the varying price levels among countries and gives a clearer comparison of output quantities.
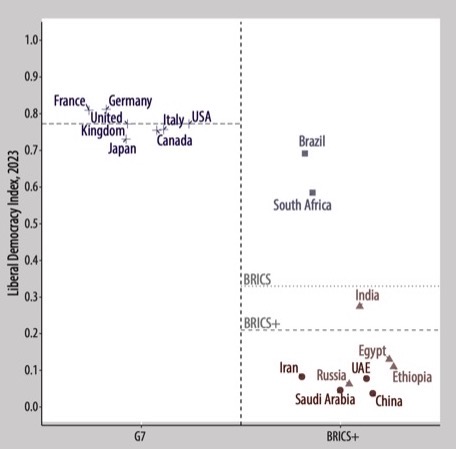
Figure F shows that G7 nations have high levels of democracy, while the BRICS+ nations have widely varied and often low levels of democracy. The BRICS+ group, while relatively new and highly diverse, has succeeded through cooperation, especially in its effort to encourage international investment with loans in the currencies of BRICS+ members rather than in U.S. dollars. Time will tell what effect the G7-BRICS+ contest will have on global democracy and the global economy.
I conclude by simply mentioning some of the other types of international organizations, which may also affect levels of democracy. Global political and cultural organizations include the World Council of Churches (1948), the Non-Aligned Movement (1961), and the Organization of Islamic Cooperation (1969). Founded in 1949 and centering on the U.S., NATO is the world’s largest military treaty organization.
Regional political-economic organizations include the European Union, the African Union, the Association of Southeast Asian Nations, the Commonwealth of Independent States, and several more. Philanthropic organizations include Oxfam, Doctors Without Borders, Amnesty International, Catholic Relief, and many others. Overall, international organizations are remarkably varied in their purpose and activity.
For more insights into trends in democracy and autocracy, I encourage readers of this post to review V-Dem’s latest report in depth. (As a footnote, V-Dem left the horrendous 2023 war in Gaza out of its report but noted that Israel fell from Liberal Democracy to Electoral Democracy for the first time in 50 years.) Its findings may help us better understand how to consider issues of democracy at multiple levels—from national to local, and, as covered here briefly, in the various types of international governance. Further, V-Dem’s exploration of data may help identify ways to expand democracy and fairness around the world.
What is happening is simple: giant multinational corporations with reactionary agendas–especially fossil fuels and big agribusiness–are funding extremist politicians who speak to public fears and hates, whip up any hatred that seems convenient, then get elected and subvert democracy with giant-corp help. This has been facilitated by extreme inequality, with the giant reactionary corporations benefiting especially. It remains to be seen, and explained, why people have become so susceptible to hate and so immune to hope, justice, care, and common decency. Oddly, moral philosophy has risen and flourished in the last decades–it just doesn’t appeal any more. The decline of religion and the collapse of much of western religiosity into bigotry and hate is a part of this.
Pat,
Thanks for this V-Dem report. It’s very helpful right now.
Ross
I find this data very useful, but to understand the weakening of democracy I think we need to go beyond that. Specifically to think about how the dramatic increase in capital mobility and information mobility undermines the institutions (specifically the state and unions defended by the state) that offered some protection to people from the inevitable insecurities caused by capitalism. Long ago Hannah Arendt criticized abstract philosophical expositions on human rights, and argued that in the real world the only functioning human rights were those that were recognized and defended by the state and voluntary organizations in collaboration with state actors. The global rise of democracy in the 20th century coincides with the overthrow of colonialism and the rise of social democratic states, e.g. governments that provide a social safety net, defend labor unions and other pro-democracy and social justice voluntary organizations, and seek to mitigate inequality. In the US, where the New Deal offered a relatively weak form of social democracy, union density (the percent of non-agricultural wage workers who belong to unions) increased from 10% in the late 20s (e.g., before the onset of the Great Depression) to 37% in 1947. The take home pay of industrial workers doubled between 1940 and 1970. Today we’re back to 10% union density (actually inflated by a relatively high rate of unionization among government employees, about 6-7% among private employers, lower than any time since the 1890s). There have also been declines in participation in most forms of voluntary associations that used to offer solidarity and belonging. Even political parties that once presented themselves as defenders of Labor, such as the US Democratic Party or the British Labor Party, have pivoted away from labor towards dissatisfied portions of the educated and middle classes. This has happened because states find it difficult to regulate corporate behavior when it is so easy to move capital to places that have dramatically lower wages and governments that repress unions or any other forms of social protest. The current billionaire class is far richer than the richest of the Gilded Age robber barons. The top 1% in the US receive about the same portion of national income as they did in 1929 and more than double what they received in 1970. Such forms of social stability as guaranteed pensions and seniority agreements in hiring that offered stability to some parts of the labor force have disappeared. While the post-colonial states never had the resources to offer a safety net comparable to rich countries there to governments sought to decrease inequality.
Information mobility similarly undermines the sense of stability for many people. Now not only do we fail to provide for ourselves and our families, but we see our religious values, our moral values, our ideas about gender (the very word part of the cultural opposition) being undermined.
It is perhaps not surprising that so many people look to authoritarian father figures for protection in such a world.
Thank you for including me in your email list.
Pingback: Democracy and Autocracy – Patrick Manning